Detailed NCERT Solutions for 9 Mathematics 14. Statistics to simplify learning. Understand chapters clearly and practice with free solutions for better results.

Detailed NCERT Solutions for 9 Mathematics 14. Statistics to simplify learning. Understand chapters clearly and practice with free solutions for better results.
Preparing for exams becomes easier with Exercise 14.2. Whether you are studying for board exams or mid-term exams, 9 Mathematics Chapter 14. Statistics solutions provide quick revising points, well-structured answers, and additional practice material to help you score better.
ncert_solutionsEX - 14.2
Q1 : The blood groups of 30 students of Class VIII are recoded as follows:
A, B, O, O, AB, O, A, O, B, A, O, B, A, O, O,
A, AB, O, A, A, O, O, AB, B, A, O, B, A, B, O.
Represent this data in the form of a frequency distribution table. Which is the most common, and which is the rarest, blood group among these students?
Solution:
It can be observed that 9 students have their blood group as A, 6 as B, 3 as AB, and 12 as O.
Therefore, the blood group of 30 students of the class can be represented as follows.
|
Blood Group |
Numbers of student |
|
A |
9 |
|
B |
6 |
|
O |
12 |
|
AB |
3 |
|
Total |
30 |
it can be observed clearly that the most common blood group and the rarest blood group among these students is O and AB respectively as 12 (maximum number of students) have their blood group as O, and 3 (minimum number of students) have their blood group as AB.
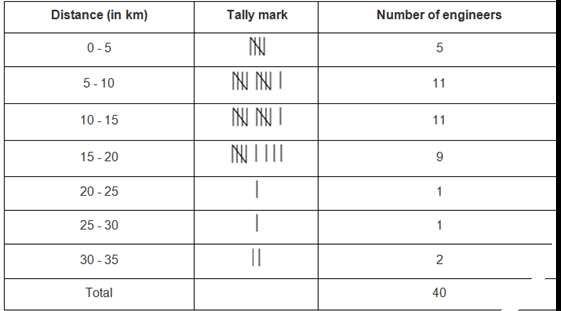
Q2: The distance (in km) of 40 engineers from their residence to their place of work were found as follows:
5 3 10 20 25 11 13 7 12 31 19 10 12 17 18 11 32 17 16 2 7 9 7 8 3 5 12 15 18 3 12 14 2 9 6 15 15 7 6 12
Construct a grouped frequency distribution table with class size 5 for thedata given above taking the first interval as 0 - 5 (5 not included). What main feature do you observe from this tabular representation?
Solution:
It is given that a grouped frequency distribution table of class size 5 has to be constructed. Therefore, the class intervals will be 0 - 5, 5 - 10, 10 - 15, 15 - 20…
Q3:The relative humidity (in %) of a certain city for a month of 30 days was as follows:
98.1 98.6 99.2 90.3 86.5 95.3 92.9 96.3 94.2 95.1
89.2 92.3 97.1 93.5 92.7 95.1 97.2 93.3 95.2 97.3
96.2 92.1 84.9 90.2 95.7 98.3 97.3 96.1 92.1 89
(i) Construct a grouped frequency distribution table with classes 84 - 86, 86 - 88, etc.
(ii) Which month or season do you think this data is about?
(iii) What is the range of this data?
Solution:
(i) A grouped frequency distribution table of class size 2 has to be constructed.The class intervals will be 84 - 86, 86 - 88, and 88 - 90…
|
Relative humidity (in %) |
Number of days (frequency ) |
|
84 - 86 |
1 |
|
86 - 88 |
1 |
|
88 - 90 |
2 |
|
90 - 92 |
2 |
|
92 - 94 |
7 |
|
94 - 96 |
6 |
|
96 - 98 |
7 |
|
98 - 100 |
4 |
|
Total |
30 |
(ii) It can be observed that the relative humidity is high. Therefore, the data is about a month of rainy season.
(iii) Range of data = Maximum value - Minimum value
= 99.2 - 84.9 = 14.3
Q4:The heights of 50 students, measured to the nearest centimeters, have been found to be as follows:
161 150 154 165 168 161 154 162 150 151
162 164 171 165 158 154 156 172 160 170
153 159 161 170 162 165 166 168 165 164
154 152 153 156 158 162 160 161 173 166
161 159 162 167 168 159 158 153 154 159
(i) Represent the data given above by a grouped frequency distribution table, taking the class intervals as 160 - 165, 165 - 170, etc.
(ii) What can you conclude bout their heights from the table?
Solution:
(i) A grouped frequency distribution table has to be constructed taking class intervals 160 - 165, 165 - 170, etc. By observing the data given above, the required table can be constructed as follows.
|
Height (in cm) |
Number of students (frequency ) |
|
150 - 155 |
12 |
|
155 - 160 |
9 |
|
160 - 165 |
14 |
|
165 - 170 |
10 |
|
170 - 175 |
5 |
|
Total |
50 |
(ii) It can be concluded that more than 50% of the students are shorter than165 cm.
Q5: A study was conducted to find out the concentration of Sulphur dioxide in the air in parts per million (p pm) of a certain city. The data obtained for 30 days is as follows:
0.03 0.08 0.08 0.09 0.04 0.17 0.16 0.05 0.02 0.06 0.18 0.20 0.11 0.08 0.12 0.13 0.22 0.07 0.08 0.01 0.10 0.06 0.09 0.18 0.11 0.07 0.05 0.07 0.01 0.04
(i) Make a grouped frequency distribution table for this data with classintervals as 0.00 - 0.04, 0.04 - 0.08, and so on.
(ii) For how many days, was the concentration of sulphur dioxide more than 0.11 parts per million?
Solution:
Taking class intervals as 0.00, - 0.04, 0.04, - 0.08, and so on, a grouped frequency table can be constructed as follows.
|
Concentration of SO2 (in p pm) |
Number of days (frequency ) |
|
0.00 - 0.04 |
4 |
|
0.04 - 0.08 |
9 |
|
0.08 - 0.12 |
9 |
|
0.12 - 0.16 |
2 |
|
0.16 - 0.20 |
4 |
|
0.20 - 0.24 |
2 |
|
Total |
30 |
.
The number of days for which the concentration of SO2 is more than 0.11 is the number of days for which the concentration is in between
0.12 - 0.16, 0.16 - 0.20, 0.20 - 0.24.
Required number of days = 2 + 4 + 2 = 8
Therefore, for 8 days, the concentration of SO2 is more than 0.11 ppm
Q6: Three coins were tossed 30 times simultaneously. Each time the number of heads occurring was noted down as follows:
0 1 2 2 1 2 3 1 3 0 1 3 1 1 2 2 0 1 2 1 3 0 0 1 1 2 3 2 2 0
Prepare a frequency distribution table for the data given above.
Solution:
Frequncy distribution table as below:
|
Number of heads |
Number of times (frequency) |
|
0 |
6 |
|
1 |
10 |
|
2 |
9 |
|
3 |
5 |
|
Total |
30 |
Q7: The value of π up to50 decimal places is given below:
3.14159265358979323846264338327950288419716939937510
(i) Make a frequency distribution of the digits from 0 to 9 after the decimal point.
(ii) What are the most and the least frequently occurring digits?
Solution:
(i) By observation of the digits after decimal point, the required table can be
constructed as follows.
|
Digit |
Frequency |
|
0 |
2 |
|
1 |
5 |
|
2 |
5 |
|
3 |
8 |
|
4 |
4 |
|
5 |
5 |
|
6 |
4 |
|
7 |
4 |
|
8 |
5 |
|
9 |
8 |
|
Total |
50 |
(ii) It can be observed from the above table that the least frequency is 2 of digit 0, and the maximum frequency is 8 of digit 3 and 9. Therefore, the most frequently occurring digits are 3 and 9 and the least frequently occurring digit is 0.
Q8: Thirty children were asked about the number of hours they watched TV Programs in the previous week. The results were found as follows:
1 6 2 3 5 12 5 8 4 8 10 3 4 12 2 8 15 1 17 6 3 2 8 5 9 6 8 7 14 12
(i) Make a grouped frequency distribution table for this data, taking class width 5 and one of the class intervals as 5 - 10.
(ii) How many children watched television for 15 or more hours a week?
Solution:
(i) Our class intervals will be 0 - 5, 5 - 10, 10 - 15…..
The grouped frequency distribution table can be constructed as follows.
|
Hours |
Number of children |
|
0 - 5 |
10 |
|
5 - 10 |
13 |
|
10 - 15 |
5 |
|
15 - 20 |
2 |
|
Total |
30 |
(ii) The number of children who watched TV for 15 or more hours a week is 2 (i.e., the number of children in class interval 15 - 20).
Q9: A company manufactures car batteries of a particular type. The lives (in years) of 40 such batteries were recorded as follows:
2.6 3.0 3.7 3.2 2.2 4.1 3.5 4.5 3.5 2.3 3.2 3.4 3.8 3.2 4.6 3.7 2.5 4.4 3.4 3.3 2.9 3.0 4.3 2.8 3.5 3.2 3.9 3.2 3.2 3.1 3.7 3.4 4.6 3.8 3.2 2.6 3.5 4.2 2.9 3.6
Construct a grouped frequency distribution table for this data, using class intervals of size 0.5 starting from the intervals 2 - 2.5.
Solution:
A grouped frequency table of class size 0.5 has to be constructed, starting from class interval 2 - 2.5.
Therefore, the class intervals will be 2 - 2.5, 2.5 - 3, 3 - 3.5…
By observing the data given above, the required grouped frequency distribution table can be constructed as follows.
|
Lives of batteries (in years) |
Number of batteries |
|
2 - 2.5 |
2 |
|
2.5 - 3.0 |
6 |
|
3.0 - 3.5 |
14 |
|
3.5 - 4.0 |
11 |
|
4.0 - 4.5 |
4 |
|
4.5 - 5.0 |
3 |
|
Total |
40 |
constructed as follows.
Exercise 14.2 are created by experts to give step-by-step explanations. Around 60–70% of exam questions are based on NCERT concepts. Our 9 Mathematics Chapter 14. Statistics solutions help you understand the core concepts and practice effectively.
Revision is the key to exam success. Our notes for 9 Mathematics highlight important formulas, key definitions, and exam-ready points from Chapter 14. Statistics. These quick revision notes make last-minute preparation easy.
Every NCERT chapter ends with exercises, and solving them is crucial. Our Exercise 14.2 include complete solutions for 9 Mathematics Chapter 14. Statistics exercises. With step-by-step answers, you gain clarity and confidence to attempt similar exam questions.
To boost your preparation, we also provide additional important questions with answers. These are prepared from previous year board papers, sample papers, and important concepts of Chapter 14. Statistics. Practicing these ensures you are well-prepared for both board and mid-term exams.
Our Exercise 14.2 are useful for both board exams and mid-term exams. For 9 Mathematics, we provide notes, exercises, and important Q&A so that you can revise smartly and write perfect answers in exams.
In short, Exercise 14.2 for 9 Mathematics Chapter 14. Statistics are a complete study package. With quick revising points, NCERT exercises, and additional important questions, you can prepare effectively for exams. Make these solutions your study companion and excel in your academic journey.
Go to other Class
Download worksheets and assignments for better practice and revision.