Detailed NCERT Solutions for 8 Mathematics 5. Data Handling to simplify learning. Understand chapters clearly and practice with free solutions for better results.

Detailed NCERT Solutions for 8 Mathematics 5. Data Handling to simplify learning. Understand chapters clearly and practice with free solutions for better results.
Preparing for exams becomes easier with Exercise 5.1 . Whether you are studying for board exams or mid-term exams, 8 Mathematics Chapter 5. Data Handling solutions provide quick revising points, well-structured answers, and additional practice material to help you score better.
ncert_solutions1. For which of these would you use a histogram to show the data? (a) The number of letters for different areas in a postman’s bag.
(b) The height of competitors in an athletics meet.
(c) The number of cassettes produced by 5 companies.
(d) The number of passengers boarding trains from 7:00 a.m. to 7:00 p.m. at a station.
Give reasons for each.
Ans.
In the case of the data given in alternative (b) and (d), we will use histogram as we can divide
The given data in class intervals. In case of alternative (a) and (c), we do not know about the numbers of letter of different areas and the number of cassettes produces by given companies. We don’t have any approximate idea about it. Therefore, we cannot define class intervals for this data and thus we will note use a histogram.
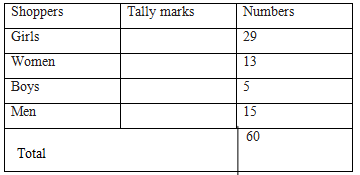
2. The shoppers who come to a departmental store are marked as: man (M), woman (W), boy (B) or girl (G). The following list gives the shoppers who came during the first hour in the morning:
W W W G B W W M G G M M W
W W W G B M W B G G M W W M M W W W M W B W G M W W W G W M M W W M W G W M G W M M B G G W
Ans:
By observing the data above, we can make a frequency distribution table as follows.
3. The weekly wages (in `) of 30 workers in a factory are.
830, 835, 890, 810, 835, 836, 869, 845, 898, 890, 820, 860, 832, 833, 855, 845,
804, 808, 812, 840, 885, 835, 835, 836, 878, 840, 868, 890, 806, 840
Using tally marks make a frequency table with intervals as 800–810, 810–820 and so on.
Ans:

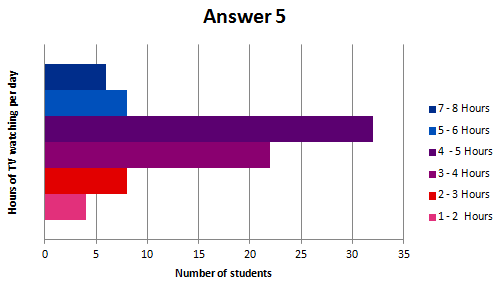
5. The number of hours for which students of a particular class watched television during holidays is shown through the given graph.
Answer the following.
Hence the total number of students = 4 + 8 + 22 = 34
Hence, total number of students = 8 + 6 = 14
Exercise 5.1 are created by experts to give step-by-step explanations. Around 60–70% of exam questions are based on NCERT concepts. Our 8 Mathematics Chapter 5. Data Handling solutions help you understand the core concepts and practice effectively.
Revision is the key to exam success. Our notes for 8 Mathematics highlight important formulas, key definitions, and exam-ready points from Chapter 5. Data Handling. These quick revision notes make last-minute preparation easy.
Every NCERT chapter ends with exercises, and solving them is crucial. Our Exercise 5.1 include complete solutions for 8 Mathematics Chapter 5. Data Handling exercises. With step-by-step answers, you gain clarity and confidence to attempt similar exam questions.
To boost your preparation, we also provide additional important questions with answers. These are prepared from previous year board papers, sample papers, and important concepts of Chapter 5. Data Handling. Practicing these ensures you are well-prepared for both board and mid-term exams.
Our Exercise 5.1 are useful for both board exams and mid-term exams. For 8 Mathematics, we provide notes, exercises, and important Q&A so that you can revise smartly and write perfect answers in exams.
In short, Exercise 5.1 for 8 Mathematics Chapter 5. Data Handling are a complete study package. With quick revising points, NCERT exercises, and additional important questions, you can prepare effectively for exams. Make these solutions your study companion and excel in your academic journey.
Go to other Class
Download worksheets and assignments for better practice and revision.