
Standard deviation plays a crucial role in the study of statistical and mathematical analysis. We also discussed some merits and demerits of standard deviation.
Check your CIBIL score here: Free CIBIL Score Official CIBIL website – check score for free
Standard deviation (SD) is an important statistical term which is usuallyused in mathematical and statistical analysis. Standard deviation is a statistical term that estimates the size of variation or scattering in a data set.
It imparts information about how spread out the values in a dataset are from the mean (arithmetic mean) or average value. In other words, standard deviation helps us toapprehend how much individual data points (observations) diverge or differ from the average.
In this blog, we will explore the concept of standard deviation and its mathematical formula. We will also elaboratethe merits and demerits of standard deviation as well as in this blog we will solve some problemscomprising standard deviation.
Standard deviation (SD), is described as the square root (√) of the variance is known as standard deviation. It is represented by the symbol σ (sigma) for a population or s for a sample. The variance is computed by calculating the mean (average) of the squared differences between each observation(data point) and the mean. Standard deviation evaluates theaverage distance between each observation(data point) and the mean (average).
Ungrouped data means the data (or information) is provided as individual points like 27, 45, 83, 17, 95, 104, etc. To compute standard deviation for ungrouped data, we use the following mathematical expression.
SD =σ = √[∑(x−x̄)2 /n]
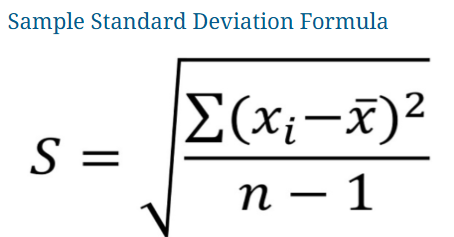
Where ∑ is a summation sign.
x denotes each individual observation of the data sets.
x̄ is mean (average) of the given data points.
nidentifies total number of the data points in the data sets.
For grouped data, the information (data) is given in equal class intervals like 7-17, 17-27, 27-37, 37-47, 47-57, etc.To calculate standard deviation for grouped data, we use the following mathematical notation.
SD =σ = √[(∑fx2/∑f) – (∑fx/∑f)2]
Here f is the frequency distribution for grouped data.
Standard deviation is a helpful tool to apprehend the degree of variability or dispersion in a dataset. It provides a numerical measure that can be easily compared across different datasets.
Assessing risk:
Standard deviation is very useful in finance and investment sectors to check out the risk related with a particular investment. Higher standard deviation insinuates greater uncertainty and higher risk, while lower standard deviation indicates more stability.
Evaluating data quality:
Standard deviation helps identify outliers or data points that significantly deviate from the mean. This is useful for detecting errors, anomalies, or extreme values in a dataset, which can impact the accuracy and reliability of the data.
Standard deviation plays a key role in different statistical calculations. It is an important key input in the computation of statistical errors of arithmetic mean which measures the precision of sample estimates. Standard deviation is also used regression, variance analysis etc. as a key component.
Sensitive to outliers: Standard deviation is sensitive to extreme values or outliers in the data. A single outlier can significantly influence the value of the standard deviation, making it less robust in such cases.
Does not capture distribution shape: Standard deviation provides information about the dispersion of data, but it does not describe the shape of the distribution. Therefore, two datasets with the same standard deviation can have different distributions.
Standard deviation presumes that the giveninformation (data) follows a normal distribution. When dealing with non-normal data particularly those with heavy tails or skewness, alternative measures like the median absolute deviation or interquartile range (Q3 – Q1) may be more appropriate.
Now let us solve some numerical problems related to that of standard deviation which will assist us to apprehend the concept of standard deviation in a better way.
Example 1:
The marks of six students in mathematics are given in the following tale. Determine the standard deviation for the given ungrouped data.
| Student No | 1 | 2 | 3 | 4 | 5 | 6 |
| Marks | 60 | 70 | 30 | 90 | 80 | 42 |
Solution:
Step 1:Let X denotes the marks of a student.First, we are to find out mean (average) of the marks.
x̄ = ∑x/n
x̄ = 372/ 6
x̄ = 62 marks.
Step 2:As the given data is ungrouped. So, we will solve it by following the mathematical formula for ungrouped data.
| X | (x - x̄) | (x−x̄)2 |
| 60 | -2 | 4 |
| 70 | 8 | 64 |
| 30 | -32 | 1024 |
| 90 | 28 | 784 |
| 80 | 18 | 324 |
| 42 | -20 | 400 |
| ∑X = 372 | ∑(x - x̄) = 0 | ∑(x−x̄)2 = 2600 |
Step 3:Place the values in the standard deviation formula for ungrouped data
SD =σ = √[∑(x−x̄)2 /n]
SD = σ = √(2600/6)
SD = σ = √433.333
SD = σ = 20.81666 which is the required result.
To find the SD of the given data without performing the above lengthy calculations, you can take assistance from a standard deviation calculator.
Example 2:
For the given data which is expressing weights of peanut brittle in gm. Determine the standard deviation for the grouped data given in the following table.
| X (gm) | 4.5 | 14.5 | 24.5 | 34.5 | 44.5 | 55.5 | 64.5 |
| f | 2 | 10 | 5 | 9 | 6 | 7 | 1 |
Solution:
Step 1: Since the given data is grouped. So, we will solve it following the mathematical formula for grouped data.
| X | f | fX | fX2 |
| 4.5 | 2 | 9 | 40.5 |
| 14.5 | 10 | 145 | 2102.5 |
| 24.5 | 5 | 122.5 | 3001.5 |
| 34.5 | 9 | 310.5 | 10712.25 |
| 44.5 | 6 | 267 | 11881.5 |
| 55.5 | 7 | 381.5 | 20791.75 |
| 64.5 | 1 | 64.5 | 4160.25 |
| Total | ∑f = 40 | ∑fX = 1300 | ∑fX2 = 52690 |
Step 2: Standard deviation formula for grouped data is
SD =σ = √[(∑fx2/∑f) – (∑fx/∑f)2]
Step 3: Place the values in the above formula and simplify.
SD = σ = √[(52690/40) – (1300/40)2]
SD = σ = √261
SD = σ = 16.155 gm.
Standard deviation plays a crucial role in the study of statistical and mathematical analysis. In this blog, we have elaborated the concept of standard deviation. We defined the formula to evaluate the standard deviation for both grouped and ungrouped data.
We also discussed some merits and demerits of standard deviation. Afterwards we solved some examples of standard deviation for grouped and ungrouped data. We hope so, after reading this blog, you will be able to solve the problems associated with standard deviation.


Download worksheets and assignments for better practice and revision.